BIM managers often have a lot of project data. Yet many BIM managers still find it hard to spot where coordination and information flows are falling apart.
Autodesk Forma can store thousands of issues, RFIs, reviews, approvals, model versions, and project records from disciplines. A survey by Autodesk and Deloitte shows that 62% of construction data that is collected and reviewed is not used by companies to make decisions.
Looking through each record one by one makes it hard for BIM managers to find patterns before those patterns start to influence deliverables, approvals, or construction work.
Power BI can connect these records and turn them into trends that help BIM managers make earlier decisions. The benefit comes from knowing what to measure, how to link the data, and which changes require action.
Key Takeaways
- Look at how management makes choices what happens before and what happens after to see how well BIM is doing, rather than just watching single project numbers.
- Take all the Autodesk Forma issues, RFIs, submittals, documents, reviews, approvals, and model data together to see how coordination and information work as a whole.
- Build a Power BI dataset by defining KPIs, keeping source relationships, checking extracted data, and keeping reporting logic consistent.
- Take the help of role-based dashboards to offer BIM managers, VDC teams, project managers, and executives a view of the project.
- Use trend analysis and management triggers to find recurring coordination problems, assign actions, and check if process changes make outcomes better.
What Should a Data-Driven BIM Management Strategy Measure?
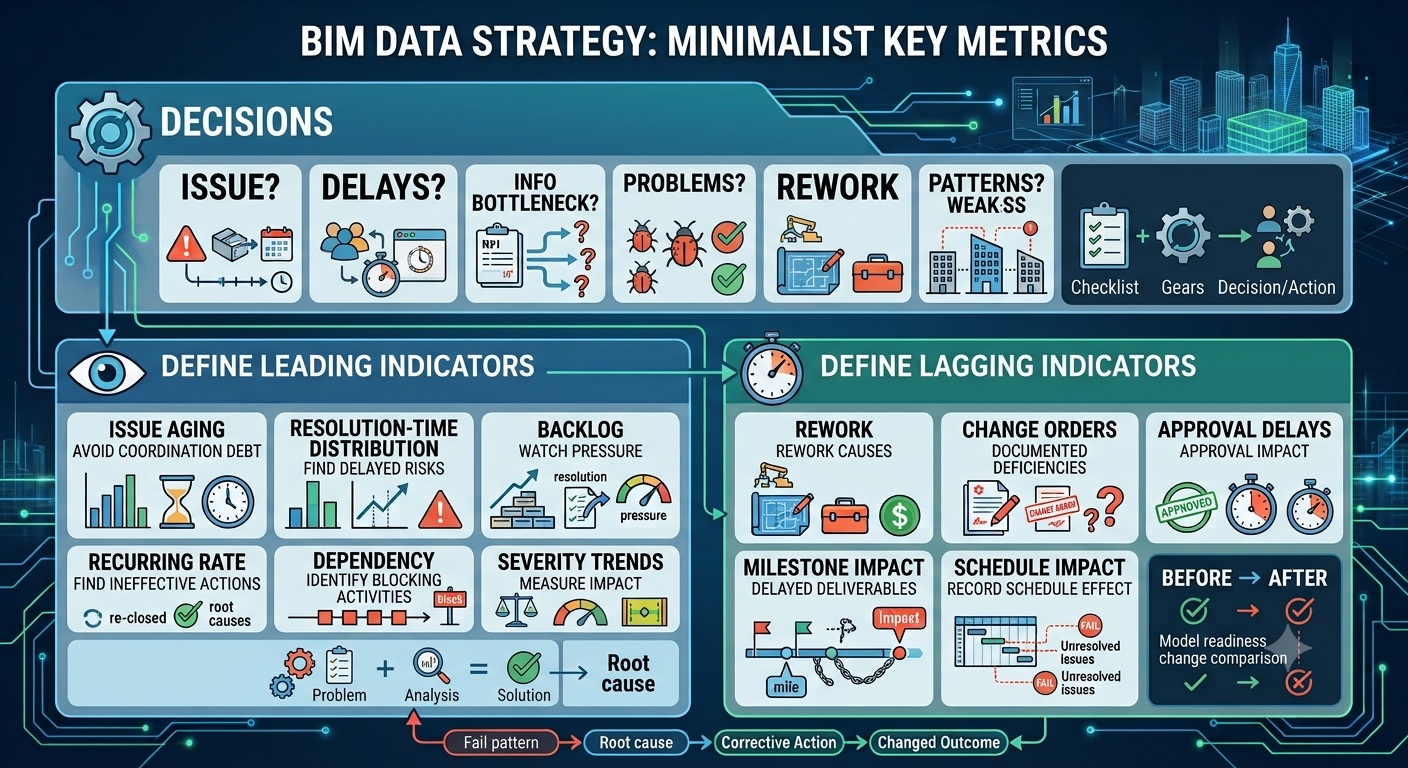
A good BIM analytics strategy should show you where project controls are failing. It should also show you why those project controls are failing and if fixing the problem actually changes the result.
1. Start With Management Decisions
You need to make your management choices before you choose your KPIs. Each and every measurement should provide an answer about how the project’s doing or result in a specific step to take.
Think about questions like:
- Which unresolved issues are getting close, to a point where they might mess up design or construction activities?
- Which disciplines have persistent resolution delays despite receiving issues within agreed review windows?
- Where are RFIs or reviews accumulating because the required information is not reaching the responsible team?
- Which coordination problems recur after being marked resolved?
- Which review workloads are exceeding the capacity established in the BIM Execution Plan?
- Which problems appear across multiple projects and indicate a weakness in the organization’s BIM process?
- Which conditions justify escalation to the design manager, VDC director, project manager, or contractor?
A useful metric needs a decision rule behind it. If issue aging exceeds the agreed resolution period for two consecutive cycles, for example, the BIM manager might review ownership, escalation, and upstream dependencies.
The same principle applies to RFI response time. Instead of reporting an overall average, segment response time by discipline, responsible party, category, priority, and project phase.
Averages can hide a concentrated bottleneck. One discipline may respond within 24 hours while another consistently takes several days, creating downstream dependencies that the project-wide average doesn’t reveal.
2. Define Leading Indicators
Leading indicators should expose conditions that precede delivery problems, giving BIM managers time to investigate the cause.
Useful measures include:
- Issue aging by cohort: You should keep track of issues based on when an issue was created and how long it takes to fix that issue. If the older group of issues keeps growing, it might mean the team has problems with coordination that carry over from one review cycle to another.
- Resolution-time distribution: Do not just look at the time. You should watch the middle and the upper end of resolution times. A few issues that take time to fix can bring more risk to the project than what the average time shows.
- Review backlog growth: Count how many new review findings appear and how many people close the review findings. If the backlog grows faster than the team can finish the review findings, the coordination pressure will rise.
- Recurring issue rate: Look at issue types and locations that keep coming after they are closed. Recurrence shows that the corrective actions may not have worked, that design decisions were not fixed, or that modeling practices are still making the same problem happen again.
- Overdue dependency rate: Identify overdue reviews, approvals, or responses that block subsequent activities rather than treating every overdue item equally.
- Finding severity trends: Separate minor model-quality findings from issues capable of affecting geometry, constructability, documentation, or downstream coordination.
Suppose ceiling coordination issues increase across three review cycles. The stronger signal isn’t the issue count alone.
If the same zones repeatedly generate issues, resolution time increases, and architectural revisions continue after MEP coordination, you have evidence of an upstream coordination problem.
This pattern may require a design decision or revised coordination sequence rather than another clash review.
3. Define Lagging Indicators
Lagging indicators should show whether the conditions identified earlier produced measurable project consequences.
Track outcomes such as:
- Rework attributed to coordination: Separate documented BIM or design coordination rework from field changes caused by scope, site conditions, or owner decisions.
- Coordination-related change orders: Identify changes with a documented connection to coordination or information deficiencies rather than treating every change order as a BIM failure.
- Approval delays: Measure the delays against the planned approval durations and check whether incomplete or conflicting information caused the approval delays.
- Milestone impacts: Connect the delayed BIM deliverables, coordination decisions, or approvals with the project milestones that were affected by the milestone impacts.
- Coordination-related schedule impacts: Record schedule effects where unresolved coordination issues have a documented causal relationship.
If a coordination issue remains unresolved across three cycles, generates repeated RFIs, requires additional design revisions, and contributes to a delayed approval, the dataset can show a progression rather than isolated events.
If you change model readiness requirements or introduce an additional discipline review, compare recurrence, resolution time, review findings, and downstream impacts before and after the change.
Also Read: How BIM Enhances Raised Access Floor Design, Coordination, And Maintenance
Once you’ve defined what effective BIM management should measure, the next step is identifying the Autodesk Forma data that can provide those measurements.
Which Autodesk Forma Data Can Support BIM Management?
Autodesk Forma contains a large amount of project data, but BIM managers don’t need every available field in Power BI. The useful records explain coordination performance, information delays, model quality, and delivery impact.
Four groups provide most of the useful context:
1. Issues and Coordination Records
Issue records show how coordination problems move through the project. The useful analysis comes from looking at patterns across several coordination cycles.
For coordination analysis, these fields give you enough context to see where issues are forming and what may be causing them:
- Status and age: Compare unresolved issues by age and review cycle. If older issues keep accumulating, check whether ownership, escalation, or upstream decisions are holding them open.
- Issue type: Use consistent categories across projects. Repeated categories can point to recurring problems in modeling, design review, or coordination.
- Discipline or trade: Compare how many issues each discipline receives, creates, and closes. A team with fewer issues but much slower resolution may still be creating a bottleneck.
- Priority: Compare issue priority with actual resolution time. High-priority issues that remain open beyond the agreed period need closer review.
- Assignee: Look for unresolved work repeatedly sitting with the same people or teams. The cause may be workload, responsibility, or dependency on another discipline.
- Location: Group issues by floor, zone, room, or system. Repeated problems in one area can point to a localized design or coordination constraint.
- Creation and closure dates: Use these dates to calculate resolution time, backlog growth, and recurrence between review cycles.
The combined pattern matters more than an individual number. For example, MEP issues repeatedly appearing around the same ceiling zones, staying open longer, and generating related RFIs could point to a space-planning or design coordination problem.
2. RFIs and Submittals
RFI and submittal records show where teams need information that isn’t being resolved through existing models, drawings, or coordination workflows.
The following fields help separate routine information requests from delays that can affect coordination and downstream work:
- RFI volume by category: Separate coordination questions from scope clarifications, field conditions, procurement issues, and other causes.
- Response time: Compare turnaround by discipline, responsible party, category, and project phase.
- Responsible party: Look for repeated delays associated with particular teams or responsibility groups.
- Submittal status: Find records that remain in review stages longer than the agreed timeframe.
- Review turnaround: Compare actual review duration with the project’s planned response period.
- Overdue records: Connect delayed responses with reviews, approvals, or other activities waiting on that information.
A better signal appears when recurring RFI categories overlap with model issues from the same discipline or building area. That pattern can point toward incomplete information, coordination gaps, or unclear responsibility.
3. Documents and Project Records
Documents and project records provide the timeline needed to understand what happened around a coordination problem. These records can help you connect model changes with reviews, approvals, and project events:
- Documents: Model and drawing versions, publication dates, and controlled project information.
- Reviews: Findings, assignments, review dates, and completion dates.
- Approvals: Submission dates, approval status, and turnaround time.
- Daily project records: Site observations and activities that may explain field conditions connected to design or coordination issues.
- Other project activity: Records showing when design changes, reviews, coordination activities, and construction events occurred.
Version history becomes useful when tracing the cause of an issue. Suppose an issue appears soon after an architectural model revision. Comparing the model version, publication date, review activity, and issue creation date can show whether the issue followed that revision.
This evidence gives the BIM team a stronger basis for deciding whether the problem came from the design change, delayed coordination, or another project condition.
4. Model Information
Model data answers a different question from workflow data. It shows what information exists in the model, while issues, RFIs, reviews, and approvals show what happened around that information.
For model-level analysis, these fields provide the detail needed to assess information quality and connect model conditions with project activity:
- Element IDs: Provide traceability when related project records contain compatible identifiers.
- Categories: Allow analysis of specific element groups for information completeness or recurring coordination conditions.
- Properties: Support checks against required project parameter information and model attributes.
- Quantities: Support model-based quantity analysis after the model reaches the required information maturity and passes validation.
- Model versions: Show which model iteration existed when an issue, review, or RFI occurred.
- Discipline information: Allow comparisons between model content and coordination activity across disciplines.
Don’t connect records simply because they belong to the same project. Power BI relationships should exist only where the project data provides a reliable identifier or documented connection between records.
This distinction matters when measuring performance:
- Model data can show whether required information exists and remains consistent
- Workflow data can show how teams review, coordinate, approve, and resolve that information
When those relationships are reliable, BIM managers can trace a recurring problem from the project record back to its affected discipline, model area, or information source. This makes the dashboard useful for investigation.
Must Read: 3D Models In Structural Engineering: Benefits, Uses & Challenges
Once you know which Autodesk Forma data can support your BIM metrics, the next step is connecting that data to Power BI for consistent analysis and reporting.
4 Ways to Connect Autodesk Forma With Power BI
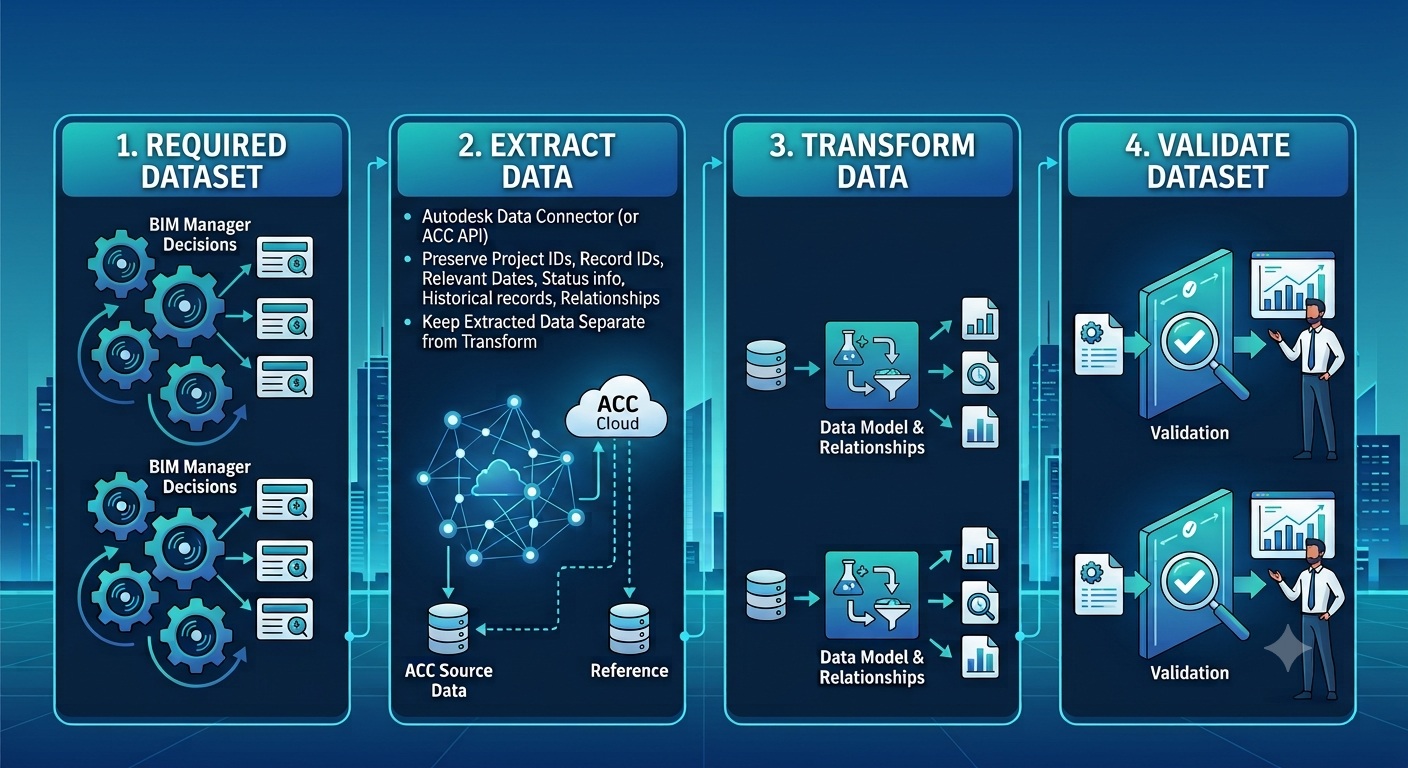
Connecting Autodesk Forma with Power BI requires more than importing project records. The reporting model needs to preserve the context behind each KPI so BIM managers can trace trends back to project activity.
1. Define the Required Dataset
Start with the management questions the report needs to answer, then select only the Autodesk Forma & Revit model records required for those decisions.
A coordination dataset may include issues, RFIs, reviews and approvals, and models. Define each KPI before building the Power BI measures.
An issue resolution KPI, for example, needs one agreed start and end point. Without that definition, two projects can report different results from the same type of issue.
2. Extract Data From Autodesk Forma
Autodesk’s Data Connector can provide Autodesk Forma project data for analysis where the required information is available through the service.
The extraction process should preserve:
- Project identifiers
- Source record identifiers
- Relevant dates
- Status information
- Historical records needed for trend analysis
- Relationships between source records where available
Keep the extracted source data separate from the transformed reporting tables. This gives you a reference when a Power BI result needs to be checked against Autodesk Forma.
You can also leverage automation tools such as ZEN to extract structured data directly from Revit into CSV files, which can then be seamlessly integrated with Power BI.
3. Transform Data in Power BI
Autodesk Forma data needs a consistent structure before you can compare performance across projects or disciplines.
The transformation process should address:
- Data cleaning: Remove duplicate records and resolve inconsistent values.
- Field transformation: Map project-specific terms into common reporting values where comparisons require standardization.
- Calculated measures: Define issue age, resolution time, response time, backlog, and overdue rates using agreed formulas.
- Filters: Allow users to examine results by project, discipline, issue type, priority, location, or project phase.
- Reporting logic: Keep KPI calculations consistent across report pages and dashboards.
An issue may represent one coordination condition, while a model table may contain thousands of elements. A direct join can duplicate issue records and produce inflated counts.
The data model should therefore keep each dataset at its appropriate level and introduce relationships only where the underlying records support them.
4. Validate the Power BI Dataset
Validate the reporting model against Autodesk Forma before using its results for project decisions.
Check all of the following:
- Record counts: Confirm that the expected issues, RFIs, reviews, and other records reached Power BI.
- Field values: Compare sample records for status, discipline, priority, assignee, and category.
- Dates: Verify creation, response, review, and closure dates used in calculations.
- Relationships: Check that linked records connect correctly without duplication.
- Calculated results: Recalculate representative KPIs and compare them with Power BI outputs.
If Autodesk Forma shows 18 issues closed during a coordination cycle, the corresponding Power BI view should return the same 18 records. A different result requires investigation before the metric is reported.
BIM managers should be able to move from a reported trend to the Autodesk Forma records behind it and understand what caused the result.
Connecting Autodesk Forma to Power BI helps make project data easier to analyze. However, the dashboard still needs to show the decisions that each project role must make.
How Should BIM Managers Design Role-Based Power BI Dashboards?

A role-based dashboard should reflect the decisions each project role controls, not simply display different versions of the same KPI set. Keep KPI definitions consistent across the report, but change the analysis based on each role’s responsibilities.
1. BIM Manager Dashboard
The BIM manager has to figure out if the problems with the model and coordination happen once or if they are part of an issue, with how work is done or how quality is checked. The dashboard needs to display the following:
- Model review status: Compare submission, review, return, and acceptance patterns. Track findings that appear again in successive model versions to identify ineffective corrections.
- Discipline performance: Compare resolution time, recurring findings, and unresolved workload against each discipline’s model scope. Raw issue counts alone don’t provide a fair comparison.
- BIM deliverables: Compare planned submission dates with actual dates, review outcomes, and correction cycles. Repeated late submissions can indicate problems with model readiness or review capacity.
This view should help the BIM manager determine whether corrective action belongs in model production, coordination, QA/QC, or the delivery workflow.
2. VDC and Project Management Dashboard
VDC and project managers need to understand when BIM activity creates conditions that could affect upcoming project decisions. The dashboard should connect coordination and information records with project timing.
- Coordination workload: Relate aging and high-priority issues to upcoming coordination milestones and affected areas of work. An unresolved issue becomes more relevant when its location or system connects to near-term construction activity.
- Submittals: Show delayed reviews alongside upcoming procurement, fabrication, or construction activities when those relationships are available. The timing matters more than the total number of overdue submittals.
- Upcoming deadlines: Combine BIM deliverables, coordination cycles, reviews, and information exchanges against planned dates. This helps identify information that may not be ready when the next project activity depends on it.
- High-priority project concerns: Surface unresolved conditions that sit close to a decision, release, procurement activity, or construction milestone. These records deserve attention because their timing can increase project exposure.
The dashboard should answer which unresolved BIM or information conditions could affect the next project activity and who owns the response.
3. Executive Dashboard
Executives need project and portfolio patterns that can support decisions about delivery performance, risk, and organizational improvement. The dashboard should therefore reduce operational detail while preserving meaningful trends.
- Overall project health: Combine agreed indicators covering coordination, information delivery, BIM deliverables, and project performance. Keep the calculation logic consistent with the detailed project dashboards.
- Major risks: Show persistent coordination problems, delayed information, approval bottlenecks, and issues approaching important project milestones.
- Cross-project trends: Compare recurring issue categories, resolution performance, review findings, and information delays across projects. Repeated patterns can indicate a process problem that individual project teams won’t solve independently.
- Delivery performance: Connect BIM and information milestones with broader delivery performance when the available data supports that relationship.
- High-level BIM performance: Show whether coordination workload, resolution time, model findings, and information delays are improving or deteriorating over time.
Cross-project analysis can expose problems that require changes to project standards, training, workflows, or BIM Execution Plans.
Role-based dashboards help teams understand current project conditions, while trend analysis can reveal risks before they become delivery problems.
How Can Power BI Help BIM Managers Identify Emerging Project Risks?

Power BI becomes useful for risk detection when you analyze changes across Autodesk Forma records. The goal is to identify conditions that are becoming harder to resolve before they affect project delivery.
1. Detect Coordination Bottlenecks
Analyze how coordination workload changes between review cycles to determine whether unresolved work is accumulating. This includes issue age, priority, discipline, location, and resolution performance.
Compare these patterns with model maturity, design changes, and project phase before treating an increase as a developing risk.
2. Identify Recurring Workflow Problems
Recurring issues become a management concern when the same condition continues after teams have attempted to resolve it.
Analyze repeated patterns in:
- Modeling practices: Findings that return in the same model category or discipline can indicate inconsistent modeling methods or incomplete discipline-level QA/QC.
- Design coordination: Repeated conflicts between the same disciplines, systems, or locations can indicate an unresolved design interface.
- Review procedures: Findings that return after correction can indicate that the review or correction process isn’t addressing the underlying condition.
- Project workflows: Repeated delays around publishing, review, or approval can expose process constraints outside the model.
Compare recurring findings against model versions and coordination cycles to distinguish genuine recurrence from unrelated issues sharing the same category.
3. Analyze Information-Flow Problems
Connect RFIs, reviews, approvals, and coordination records to identify delays caused by incomplete or late information.
Look for:
- RFI response times: Compare turnaround by category, responsible party, discipline, and project phase.
- Repeated RFI categories: Identify requests that continue appearing after related model updates or design reviews.
- Review delays: You should look at how long things actually take and then compare those times to the timelines you agreed on. You should try to find out if certain groups or specific steps in the workflow are causing the review delays every time.
- Discipline-specific requests: Find out which teams are always asking for more details or saying they do not have enough information. Once you find those teams, compare those requests with records to see if there is a pattern you can follow.
The strongest signal appears when different record types point to the same condition. For example, recurring structural RFIs combined with aging structural issues in the same area provide stronger evidence than either metric alone.
4. Establish Management Triggers
Define thresholds that distinguish normal project variation from conditions requiring investigation.
Useful triggers include:
- Issues exceeding agreed resolution periods
- High-priority issues remaining open near affected milestones
- Increasing carryover between coordination cycles
- Findings recurring across model versions
- RFI responses exceeding agreed periods
- Review delays affecting dependent information
- Increasing issue concentration within a discipline, location, or system
Set limits based on what the project needs, how often people work together, and how advanced the model is. When things need to be delivered instead of using the same rules for all projects.
The trustworthiness of a risk analysis depends on how it is reported, so even small mistakes in the analysis can quickly create wrong signs about the project.
Mistakes That Undermine Autodesk Forma and Power BI Analytics
Power BI can produce technically accurate reports while still supporting poor BIM management decisions. The problem usually starts with what the team measures, compares, and acts on.
Mistakes | Solutions |
Building dashboards before defining the management need | Define the management decision first, then select the Autodesk Forma data and KPIs needed to support it |
Tracking more metrics than teams can act on | Keep only metrics that can influence an investigation, decision, escalation, or corrective action |
Comparing data that wasn’t standardized | Standardize project definitions for statuses, disciplines, issue types, responsibilities, locations, and resolution rules before comparing results |
Treating every metric as real-time information | Set refresh frequency according to how quickly the condition changes and how quickly the team needs to respond |
Reporting numbers without their context | Interpret each metric alongside project phase, model maturity, coordination cycle, priority, location, and upcoming milestones |
Presenting findings without a responsible action | Assign an owner and define the required response whenever a metric crosses its management threshold |
Ignoring inaccurate source records | Validate Autodesk Forma records for missing values, duplicates, incorrect statuses, dates, assignments, and relationships before calculating KPIs |
Wrapping Up
Power BI shouldn’t become another reporting layer that BIM teams maintain without changing how projects are managed. Its value comes from connecting project data with the decisions your team needs to make.
Now the next step is to use those insights to improve the BIM process itself. When coordination delays happen, often review results or information slowdowns appear across projects; see them as proof for changing standards, workflows, or team duties and adjust the BIM process accordingly.
Over time, this creates more than project dashboards. You build an evidence base that helps your BIM team set better expectations, improve coordination processes, and make future projects more predictable.
Are you looking for BIM Solutions?
BIM ASSOCIATES is your one-stop BIM solution provider for the Architecture and Structure discipline. With 15+ years of work experience in BIM projects, their team helps clients with better decision-making, cost savings, efficient construction planning, and green earth initiatives.
You Might Also Like: Mastering BIM: A Step-By-Step Guide To BIM Execution And Implementation Plan
FAQs
1. Which Autodesk Forma data should BIM managers prioritize for Power BI reporting?
Focus on records that help you make management decisions. This includes issues, RFIs, reviews, approvals, model information, and deliverable status. The right dataset will depend on the KPIs you want to monitor.
2. What makes a BIM KPI reliable across different projects?
A KPI becomes comparable when projects use consistent definitions for statuses, disciplines, issue types, dates, ownership, and calculation rules. You should also account for differences in project phase, scope, model maturity, and coordination requirements before comparing results.
3. When should a BIM team use Power BI instead of reviewing Autodesk Forma directly?
Use Power BI when you need to identify trends, compare project performance, combine multiple record types, or monitor changes over time. Autodesk Forma remains the source for investigating individual records and reviewing the project context behind reported results.
4. Which BIM analytics can reveal problems that individual project teams may miss?
Cross-project analysis can reveal recurring coordination issues, review delays, RFI patterns, or model-quality findings that appear across multiple teams. These patterns can point to weaknesses in organizational standards, QA/QC processes, training, or BIM Execution Plans.
5. What should BIM managers do when Autodesk Forma data contains gaps or inconsistent records?
Identify missing, duplicated, outdated, or inconsistent records before using them in KPI calculations. Document the treatment of those records so users understand where data limitations could affect reported project performance.